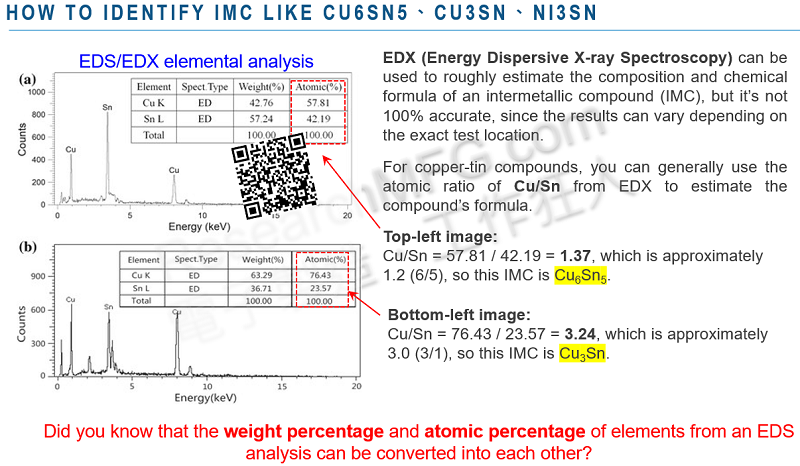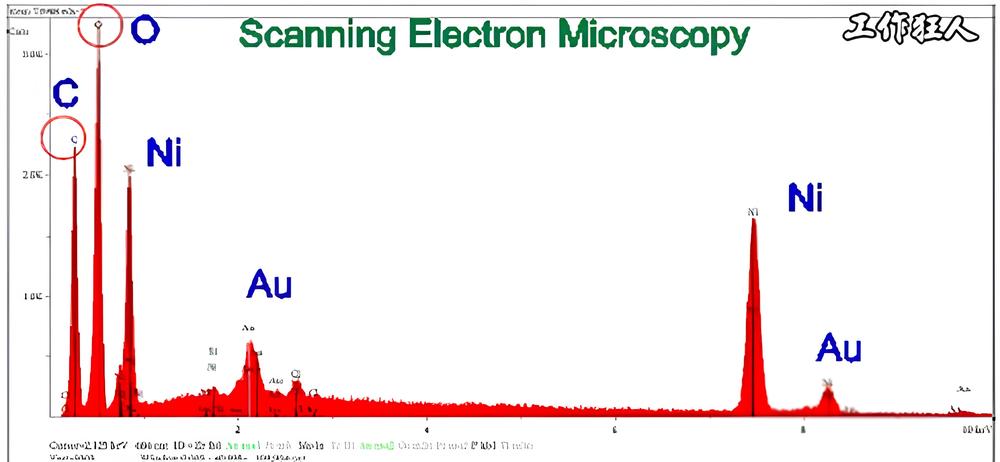
In failure analysis reports for PCB assembly defects, we often use EDX or call EDS (Energy-Dispersive X-ray spectroscopy) for chemical elemental analysis. However, many people don’t fully understand how EDX works, and they have only a vague idea of how to interpret an EDS elemental analysis report. In most cases, after running an EDX scan and obtaining an elemental analysis, they get stuck—unsure of what to do next. The real question is: What useful information can EDX actually provide?
So, when someone suggests sending a defective sample to lab for EDS analysis, what results are you expecting? Can EDX really help you pinpoint the root cause of the issue?
Even Workingbear doesn’t claim to be an expert in EDX/EDS—it was a long journey of trial and error to get familiar with it. This article serves as an introduction, and I hope others will join in to discuss this topic further.
If you’re wondering what EDX/EDS is (Click Here), here’s a quick reminder: EDX/EDS can only detect elements (as listed in the periodic table). It cannot determine chemical formulas (for example, it cannot identify H₂O).
Below, Workingbear outlines four common questions that many people struggle with when interpreting an EDX/EDS report. Due to space limitations, this article will cover the first two topics, with the remaining two discussed in a follow-up article.
(Disclaimer: The following information is based on Workingbear’s observations and discussions. If any experts come across mistakes, please feel free to correct them!)
1. What’s the Difference Between Weight% and Atomic% in an EDX Report? Can They Be Converted? Should We Use wt% or at% in EDS Analysis?
Understanding Weight% and Atomic%
-
Weight% (wt%) represents the percentage of an element’s weight in a sample. It is calculated by dividing the detected weight of a specific element by the total weight of all detected elements in the sample.
-
Atomic% (at%) represents the percentage of an element’s atomic count in a sample. It is calculated by dividing the number of detected atoms of a specific element by the total number of detected atoms in the sample.
These two values can be converted into each other, and the key factor in this conversion is the atomic weight of each element.
How to Convert wt% to at%
To convert wt% to at%, divide each element’s weight percentage (wt%) by its atomic weight (from the periodic table). This gives the number of atoms of that element. Then, divide the number of atoms of each element by the total number of atoms in the sample to get the atomic percentage (at%).
How to Convert at% to wt%
Conversely, to convert at% to wt%, multiply each element’s atomic percentage (at%) by its atomic weight. This gives the weight of that element. Then, divide the weight of each element by the total weight of all elements to get the weight percentage (wt%).
Example of wt% to at% Conversion
 A user provided the following real EDX/EDS measurement data, which we can use to verify the conversion between wt% and at%.
- The wt% of carbon (C) is 19.26%
- The atomic weight of carbon (C) from the periodic table is 12.011
Using the formula: 19.26 ÷ 12.011 = 1.60353 (number of atoms of carbon)
Now, summing up the total atomic count for all elements in the sample (3.16254), we calculate:
(1.60353 ÷ 3.16254) × 100% = 50.70%
Thus, the calculated at% of carbon is 50.70%.
Other elements can be calculated in the same way. Below is a table generated using Excel formulas (note: minor rounding errors may occur).

To convert at% back to wt%, simply reverse the calculation—multiply at% by the atomic weight of each element to obtain its weight.
Should You Use wt% or at% in an EDS Report?
Many people wonder whether they should focus on weight percentage (wt%) or atomic percentage (at%) in EDS elemental composition reports. There is no universal answer—it depends on the specific application.
When to Use Weight% (wt%)
Use wt% when analyzing the composition of materials, such as alloys or chemical formulations. It’s ideal for studying alloy compositions, contamination levels, material density, and overall mass distribution.
When to Use Atomic% (at%)
Use at% when studying chemical reactions, oxides, compound ratios, or contamination mechanisms. For example, if you want to understand the chemical composition of oxides or contaminants (e.g., Cu₂O, CuO, SnO₂) or examine stoichiometric relationships between elements, atomic percentage is more relevant.
General Rule:
- If you’re focusing on the physical composition of materials, use wt%.
- If you’re studying chemical interactions and ratios, use at%.
2. Why Does the Same Element Show Multiple Peaks in EDX Analysis? What Do K, L, and M Mean?

The reason EDX measurements show multiple peaks is related to an element’s electron shells and energy levels. To understand this better, it’s helpful to review some basic chemistry.
Atoms have different electron orbitals (shells) based on their atomic number. These shells, moving outward from the nucleus, follow this sequence:
- K-shell (holds 2 electrons)
- L-shell (holds 8 electrons)
- M-shell (holds 18 electrons)
- N-shell (holds 32 electrons)
- O-shell (holds 50 electrons), followed by P, Q, etc.
Why Does EDX Show Multiple Peaks?
(由 Muso – 自己的作品, CC BY-SA 3.0, https://commons.wikimedia.org/w/index.php?curid=3241031)
EDX works by using a high-energy electron beam, proton beam, or X-ray to excite atoms in the sample. This process knocks out inner-shell electrons, creating an electron hole in the atom. When an outer-shell electron moves in to fill this hole, the excess energy is released in the form of X-rays.
By collecting and analyzing these emitted X-rays (based on their energy and intensity), we can identify the element present. Since electrons from different energy levels can fill the vacancy, multiple peaks appear for the same element—each corresponding to a different electron transition.
Understanding K, L, and M Peaks in EDX
- K-line emissions occur when an L- or M-shell electron fills a vacancy in the K-shell.
- L-line emissions occur when an M- or N-shell electron fills a vacancy in the L-shell.
- M-line emissions occur when an N- or O-shell electron fills a vacancy in the M-shell.
⚠ EDX Limitations:
- EDX cannot detect hydrogen (H) or helium (He) from the first row of the periodic table.
- For elements in the second row, only K-line spectra can be detected.
- For elements in the third row, L-line spectra can also be detected.
- For elements in the fourth and fifth rows, both K and L lines are commonly used.
Which Peak (K or L) Should Be Used for Elemental Calculation?
In general, we select the most stable and interference-free peak for measurement. The choice depends on the element:
- Second-row elements (e.g., C, O, F, Na) → K-line is the only option
- Third-row elements (e.g., Si, Cl, Ca) → Usually K-line
- Fourth and fifth-row elements (e.g., Ti, Fe, Cu, Sn, Pb) → L-line can be used
However, in some cases, K and L peaks may overlap with other elements, leading to confusion. To avoid misinterpretation, alternative peaks might be selected based on the spectral interference.
Additional Resources
Check out video explanations of EDX, SEM, and EDS-based elemental analysis for better understanding of IMC (Intermetallic Compound) composition calculations. (Please note that only the Traditional Chinese version of the video is available at the moment, but English subtitles are provided.)
Related Posts:
- Does the Gold Thickness in ENIG PCBs Affect Component Detachment?
- Concept Clarification: IMC Layer Fracture Despite the Formation of Effective Solder Joints
- Why BGA soldering ball always crack(3)? IMC layer growth is a certain result to form the soldering joints
- What is IMC (Intermetallic Compound)? How does IMC relate to PCB solder joint strength? Are there IPC standards for IMC thickness?


![[Case Study] Troubleshooting a Customer Complaint – Keypad Malfunction Caused by Oil & Powder Contamination on the PCB [Case Study] Troubleshooting a Customer Complaint – Keypad Malfunction Caused by Oil & Powder Contamination on the PCB](https://mpe.researchmfg.com/wp-content/uploads/2025/Oil_on_PCB_summary-mpe.jpg)


Leave a Reply