Workingbear has noticed that many people still have questions about EDX/EDS elemental analysis reports. This is the second article where he tries to provide answers based on his knowledge.
EDX (Energy-Dispersive X-ray Spectroscopy), also known as EDS, is actually an auxiliary function used in SEM (Scanning Electron Microscopy), TEM (Transmission Electron Microscopy), and STEM (Scanning Transmission Electron Microscopy) analysis techniques.
EDX/EDS can perform elemental analysis on areas as small as a few nanometers (nm) in diameter.
It works by using an X-ray electron beam to hit the sample, generating characteristic spectra of the sample’s elements to determine their composition at a single point.
Here, Workingbear has outlined four common questions that people might have about EDX/EDS reports. Due to space limitations, the explanations are split into two articles—this article will cover the third and fourth questions:
(The following content is based on what Workingbear has heard and learned. If any experts or knowledgeable individuals spot any mistakes, please feel free to correct them.)
3. Can we use elemental composition from an EDX report to calculate and predict a sample’s chemical formula?
Workingbear can say that it’s possible, but not easy. It depends on whether there are impurities or other compounds mixed in at the X-ray measurement spot. To estimate the chemical formula, it’s best to perform EDX/EDS on a single compound. If the sample is a composite mixture, the results will be mixed and chaotic, making it difficult to estimate the chemical formula. You can attempt to estimate it by using the atomic percentages (at%) of the elements detected.
Here’s an example: After performing EDX/EDS on pyrite, we get the following spectral data (note: actual results from EDX on pyrite usually include other elements like oxygen, so the percentages may vary):
- Fe (iron) element weight %: 46.55%
- S (sulfur) element weight %: 53.45%
The atomic mass of Fe is 55.85u, and the atomic mass of S is 32.06u. By dividing the “atomic weight percentage (el wt%)” by the “atomic mass,” we get the atomic numbers:
- Fe: 46.55 / 55.85 = 0.833
- S: 53.45 / 32.06 = 1.667
The total is: 0.833 + 1.667 = 2.5
Next, divide the atomic number of each element by the total atomic number (2.5) and multiply by 100% to convert to atomic percentage:
- Fe: 0.833 / 2.5 × 100 = 33.3% (Atomic %)
- S: 1.667 / 2.5 × 100 = 66.7% (Atomic %)
From this data, we can see that the atomic number of sulfur is roughly twice that of iron, so we can estimate the chemical formula as FeS2.
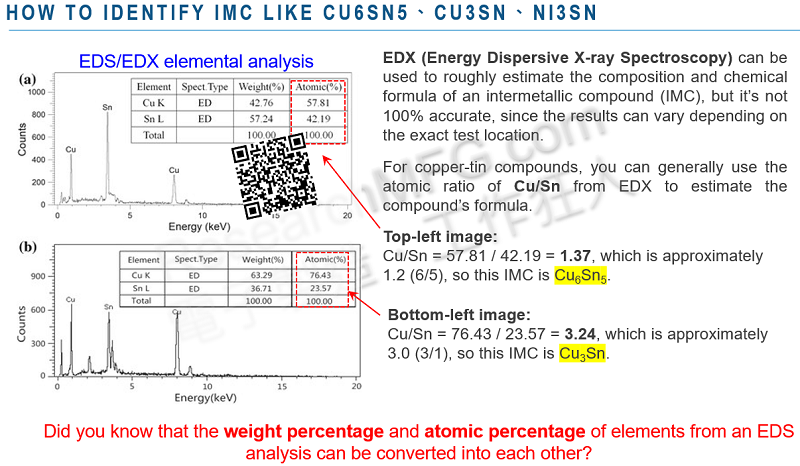
(You can also refer to the example image at the top of this article to try calculating IMC interface compounds like Cu6Sn5, Cu3Sn, or Ni3Sn?)
If you really want to confirm the molecular formula, it’s recommended to use FTIR or XPS for comparison, as these methods are more objective than EDX.
Related reading: Wondering about unknown contaminants? Which test method should you use (EDX, FTIR)?
Watch a video explaining how to convert EDX report wt% and at% percentages. (Please note that only the Traditional Chinese version of the video is available at the moment, but English subtitles are provided.)
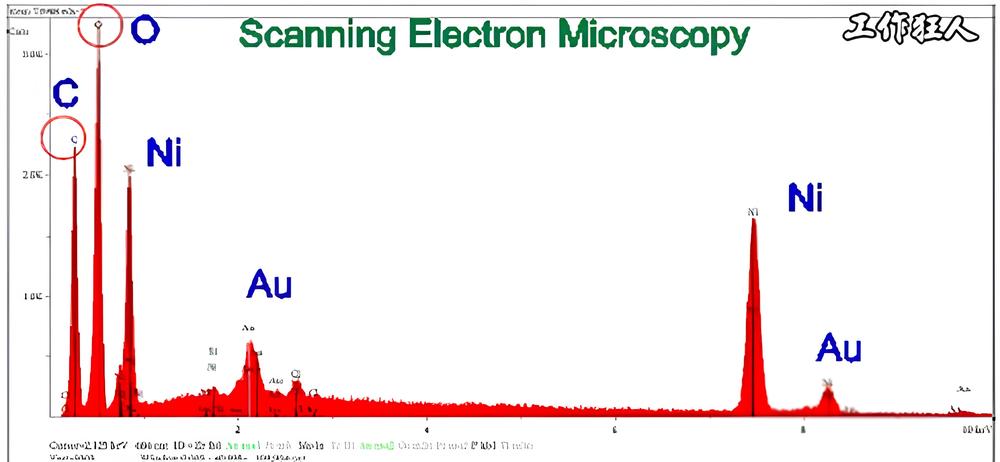
4. Why Do Carbon (C) and Oxygen (O) Always Appear in EDX Results, Even When They’re Not in the Sample?

Even though a sample may not contain carbon (C) or oxygen (O), these elements often show up in EDX analysis. Why does this happen?
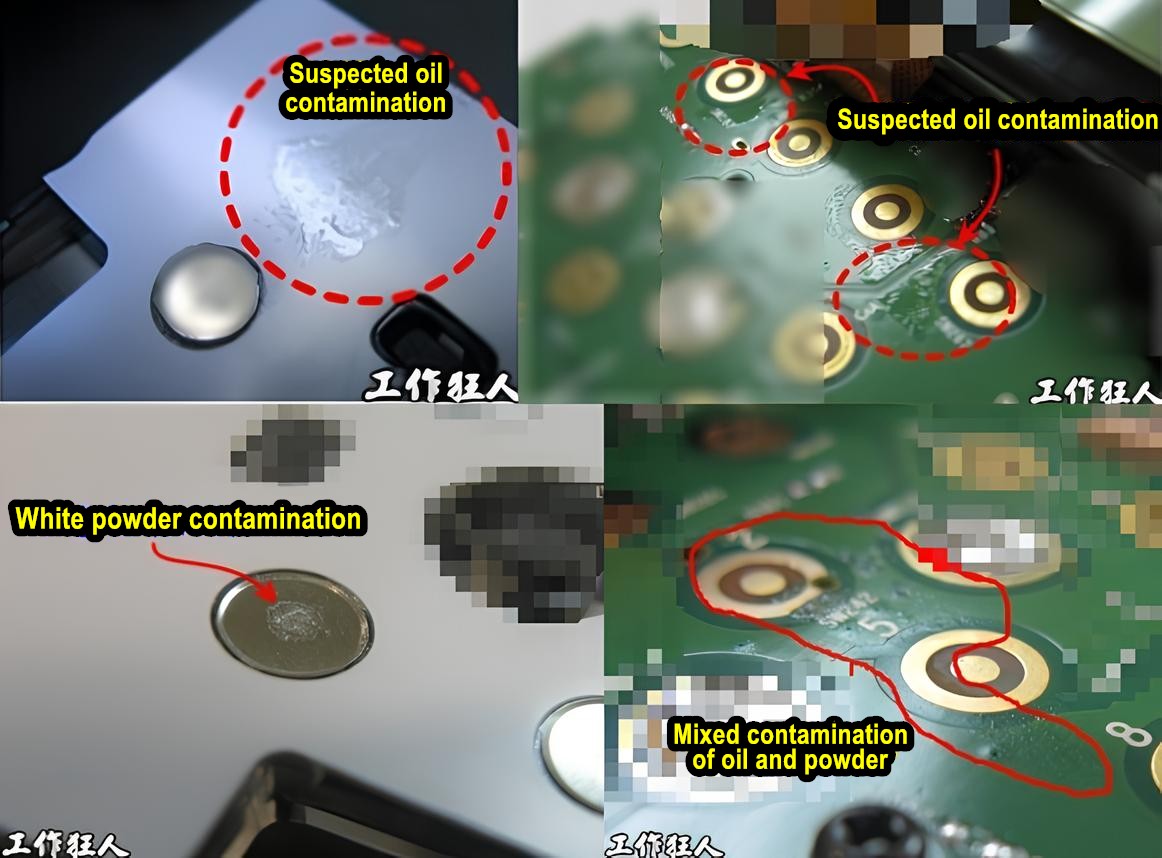
When performing SEM and EDX, the chamber is placed under vacuum, but it’s not a perfect vacuum. Some environmental contaminants always remain. Additionally, if the sample has been exposed to the atmosphere, it will inevitably develop oxides and accumulate organic dust, oils, or even fingerprint residues.
Moreover, how is the sample handled in the lab? Could there be contamination from the lab environment? Does the cleaning material used leave any residue on the sample? These factors can contribute to some level of contamination.
Oxides contain oxygen (O), while organic substances contain carbon (C) and even hydrogen (H). However, since EDX cannot detect hydrogen, only carbon (C) and oxygen (O) appear in the results. The key is to check their percentage—only if the levels are abnormally high does it become a concern that requires further investigation.
Sometimes, silicon (Si) or aluminum (Al) also show up in EDX results. This is because SEM/EDX sample holders are often made of glass or aluminum. If the sample is very thin, the X-rays may penetrate through to the substrate, leading to peaks from the base material. That’s why it’s important to carefully check the sample condition when analyzing data to rule out interference from unwanted elements.
Many people also ask why the carbon (C) content in EDX results is sometimes particularly high. There’s no single answer to this question. It could be that the sample naturally contains a high amount of carbon—for example, many solvents are carbon-based. Alternatively, the sample may have been contaminated with organic materials. Most EDX analyses are conducted due to some kind of abnormality, such as a power connector failure caused by contamination. In such cases, the contamination is often organic, and the burnt residue contains high levels of carbon.
A good practice when performing EDX is to take multiple measurements from different spots on the sample. This helps avoid misinterpretation caused by analyzing an unusual or contaminated area.
Related Posts:
- Does the Gold Thickness in ENIG PCBs Affect Component Detachment?
- Concept Clarification: IMC Layer Fracture Despite the Formation of Effective Solder Joints
- Why BGA soldering ball always crack(3)? IMC layer growth is a certain result to form the soldering joints
- What is IMC (Intermetallic Compound)? How does IMC relate to PCB solder joint strength? Are there IPC standards for IMC thickness?


Leave a Reply