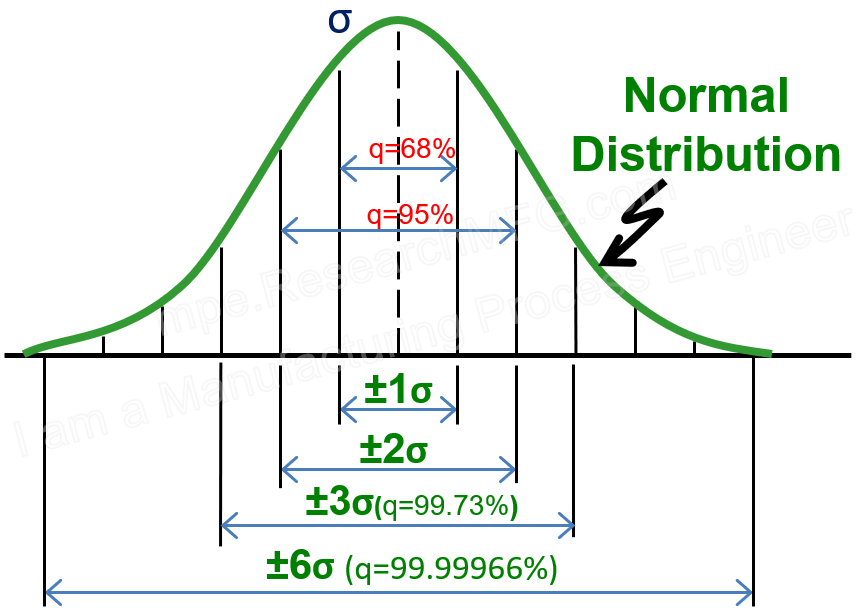
Process Capability refers to how well a process can produce quality products once it becomes stable. In real production, many variable factors can cause the process to fluctuate. By applying statistical methods, we can better understand how the process is performing and even use this data early on to improve product development.
Process Capability Analysis means measuring and analyzing these variables to understand how they relate to product requirements and specifications. It helps identify which variables have the biggest impact on quality and which ones we need to control or eliminate.
Important: Before you start using Statistical Process Control (SPC), you first need to analyze the process. You must understand the actual process capability and make sure the process is stable. Only then does it make sense to apply SPC to improve quality even further.
As Workingbear often says, improvement doesn’t happen overnight. Sometimes, you need to fix things over and over in a cycle until the process becomes stable. Only a stable process can be meaningfully controlled. If your process is constantly out of control, you’ll just end up firefighting all day.
Many companies claim they use SPC and control charts, but in practice, the charts are just for show. Some set their control limits beyond the spec limits, and others have engineers chasing issues all the time. What they often miss is that before using control charts, you must thoroughly analyze the process, find the key variable factors, and improve them. Only when those factors are under control should you begin formal process control.
 The purpose of process control is to help us understand how the process is trending. When the trend starts to drift outside the control limits, it’s a warning sign that the process may soon become unstable. At that point, corrective actions should be taken right away to bring it back within control.
It’s kind of like driving on the highway. Your car should stay between the lane lines. If you start drifting out of your lane, you might hit those little bumps on the line that make a loud rumble-rumble sound. That’s your warning to steer back before you run off the road and hit the guardrail or crash.
In general, process variables can be grouped into two types. Some are temporary variables—they only affect the process at certain times or under specific conditions. Others are continuous variables—they keep affecting the process until you take steps to control them.
To deal with both types of variation, the industry has developed a variety of tools and methods to help us identify the root causes. Some of the main tools include:
-
Stratification
-
Pareto Chart
-
Cause & Effect Diagram (also known as a Fishbone Diagram)
-
Histogram
-
Control Chart
-
Sampling Plan
-
Hypothesis Testing
-
Correlation and Regression Analysis
-
Sampling Methods
-
Design of Experiments (DOE)
Among these, tools like the Pareto Chart, Fishbone Diagram, Histogram, and Control Chart are especially popular. Workingbear will explain how to use these tools in more detail later when we have time.
》Overview and Explanation of SPC, Cpk, and Process Capability
Related Posts:
About Statistical Process Control (SPC):


Leave a Reply