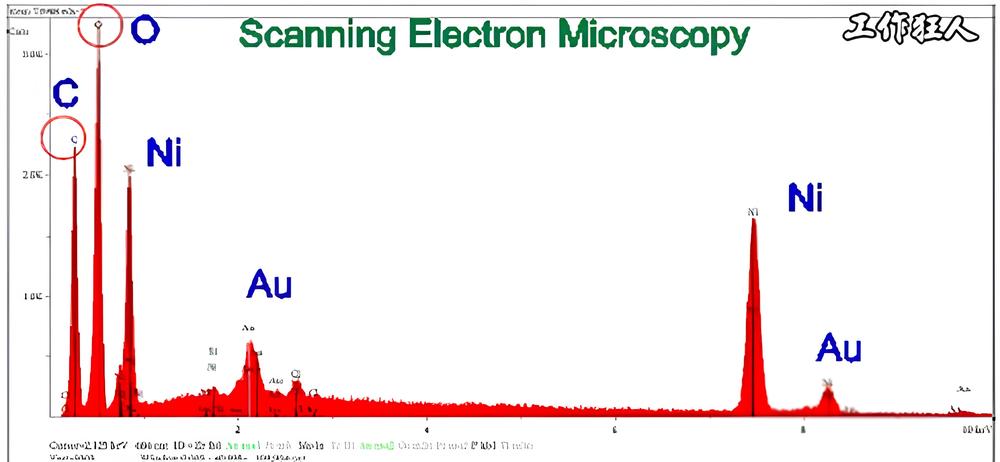
Energy-Dispersive X-ray Spectroscopy (EDS or EDX) is a common, non-destructive technique used in the industry to quickly identify the elemental composition of a sample’s surface. In electronics manufacturing and material analysis, knowing what elements are present is critical for quality control and surface-level failure analysis.
Although EDX is considered non-destructive, there are some limitations. Most EDX equipment has size restrictions, so it’s a good idea to check with the lab beforehand to make sure your sample fits. Also, in many cases, the sample needs to be cross-sectioned before analysis. That’s because EDX can only detect elements within about 5 microns (µm) from the surface, so it’s best suited for surface-level analysis.
EDX is usually used together with a Scanning Electron Microscope (SEM) or a Transmission Electron Microscope (TEM). To put it simply, the reason EDX/EDS is so well-known and widely used in the industry today isn’t just because of its ability to analyze elements. What really makes it useful is the SEM imaging that comes with it. SEM provides high-resolution, deep-focus images of the sample’s surface and near-surface areas—kind of like taking photos with a DSLR camera, except the images are always in grayscale. Any color you see is added later through post-processing.

🔬 How Does EDX/EDS Work?
When doing EDX analysis, a high-energy electron beam, proton beam, or X-ray excites the inner-shell electrons of the atoms in the sample. These excited inner electrons get knocked out, leaving behind “holes.” When outer or higher-energy electrons fall into these holes, they release extra energy in the form of X-rays. These are called characteristic X-rays, and each element has its own unique energy signature. By collecting the energy and intensity of these emitted X-rays and comparing them to known standards, we can identify which elements are present in the sample and in what amounts.
🧪Why Use EDX/EDS?
-
Non-destructive analysis: It doesn’t damage the sample, making it ideal when you need to keep the original intact. But always check if the sample size fits the equipment.
-
Fast results: Quickly provides both qualitative and quantitative information about the elements in the sample.
-
High spatial resolution: Great for analyzing tiny areas, perfect for studying microscopic structures.
-
Wide range of applications: Useful for testing everything from steel and ceramics to semiconductors.
-
Works with electron microscopes: You can get both a clear image of the sample and its elemental breakdown at the same time.
🧪 Applications of EDX/EDS
EDX/EDS is widely used across various industries and research fields:
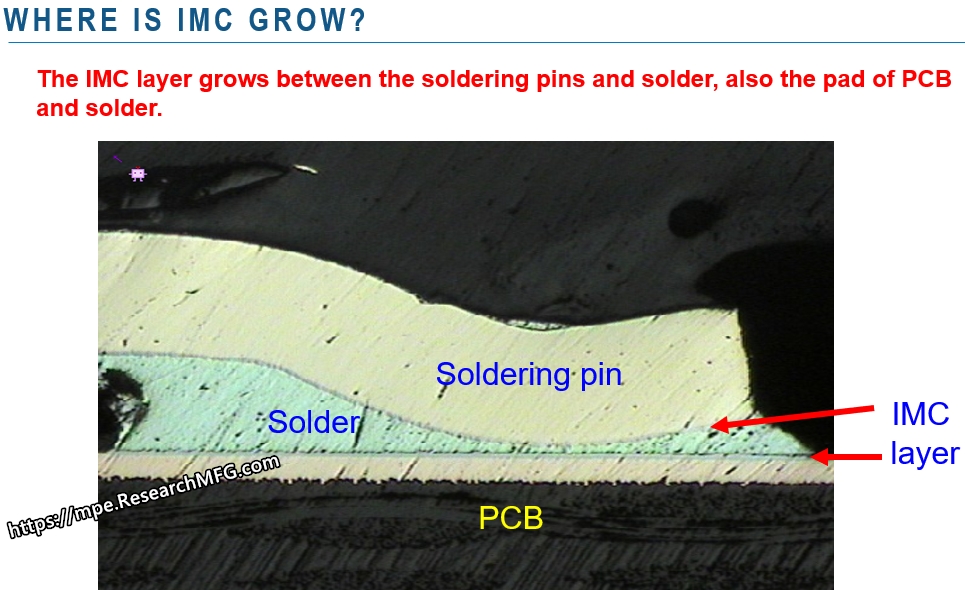
- Electronics failure analysis: EDX is especially good for analyzing the surface elements of materials. For example, it’s often used to check if the PCB finish (like ENIG) has defects, or if the phosphorus (P) content is too high after slicing the sample. It’s also paired with SEM to inspect for IMC (intermetallic compound) growth issues.

-
Materials Science: Used to analyze the element makeup and distribution in metals, ceramics, polymers, and more.
-
Semiconductors: Helps detect contamination or defects inside chips to ensure product quality.
-
Battery research: Studies the composition of electrode materials and electrolytes to improve performance.
-
Forensics: Analyzes the element makeup of evidence to help solve cases.
-
Archaeology: Identifies what artifacts are made of to better understand ancient manufacturing techniques.
- Geology: To determine the mineral composition of rocks and soils.
-
Forensics: In the analysis of trace evidence.
-
Biology: To study the elemental makeup of biological specimens.
Its ability to provide rapid, localized elemental analysis makes it a go-to method for researchers and engineers.
⚙️ Advantages and Limitations
Advantages:
-
Rapid Analysis: Provides quick results, often within minutes.
-
Non-Destructive: Minimal sample preparation required.
-
Spatial Resolution: When combined with SEM/TEM, it offers detailed spatial distribution of elements.
Limitations:
Even though EDX is a powerful tool, it does have some limitations:
-
Poor sensitivity to light elements: Elements like hydrogen (H), lithium (Li), and helium (He) are very hard to detect. That means EDX usually isn’t suitable for analyzing polymers or things like flux composition.
-
Can’t determine chemical formulas: EDX only measures how much of each element is in the sample. It can’t detect H, Li, He, or accurately determine the chemical structure or formula.
-
Sample size is limited by equipment space: EDX analysis must be done in a vacuum to avoid contamination, so the machine can only fit smaller samples. You usually can’t load a full PCBA into the chamber.

- Limited energy resolution: Sometimes it can’t tell the difference between elements with similar energy levels.
-
Quantitative accuracy can vary: Results may be affected by things like surface roughness or detector efficiency.
Can You Use EDX/EDS Elemental Analysis to Figure Out a Sample’s Chemical Formula?

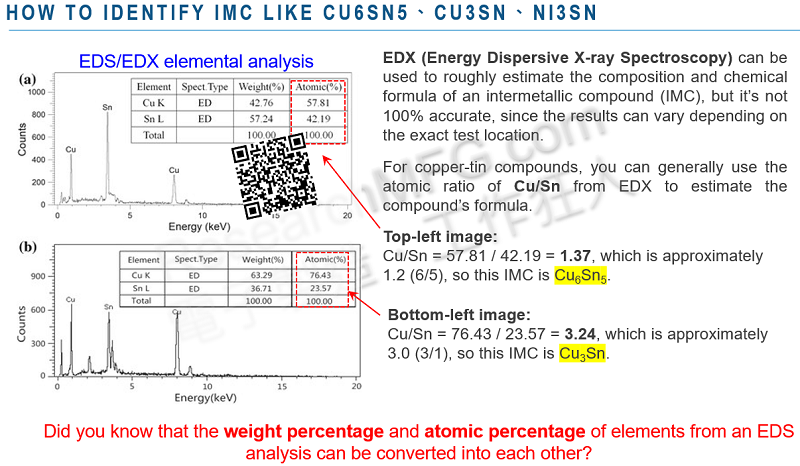
Workingbear would say—sometimes, yes. You might be able to guess the chemical formula of a sample using an EDX report, but keep in mind that EDX isn’t really designed for that purpose. And even when it works, there are a lot of limitations.
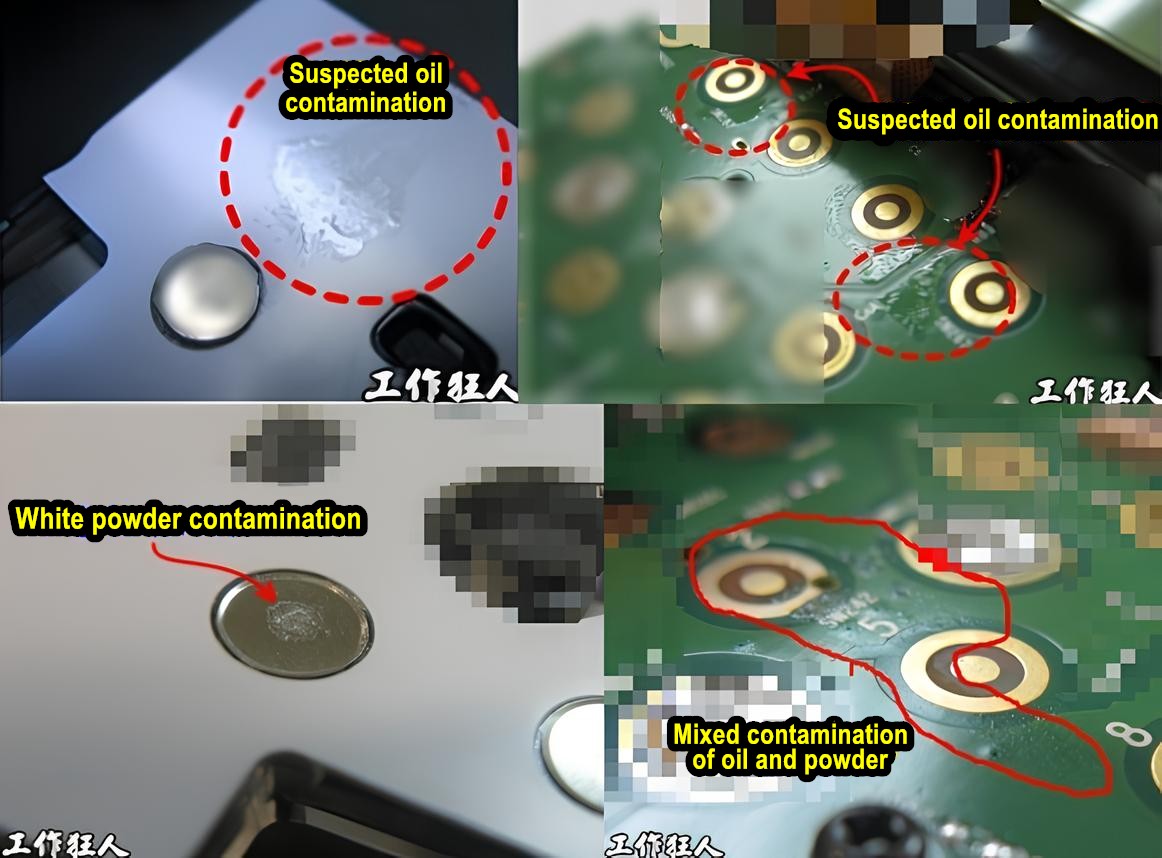
To estimate a chemical formula from EDX, the test spot needs to be on a pure compound without contamination. If the sample is a mixture, the EDX result will include all the elements from everything in the area—making it almost impossible to reverse-engineer a clear formula. Think of it like a puzzle game: imagine you take the birth dates of two strangers, break them down into year, month, and day (six numbers total), mix them all up, and then try to figure out each person’s birthday. That’s how hard it is to get a clear chemical formula from mixed EDX data.
There’s another problem—EDX can’t detect hydrogen (H), which is a key part of many compounds, especially polymers like plastics. So you can’t use EDX to analyze those materials.
If you still want to estimate a chemical formula using EDX, you should convert the results to atomic percent (at%) rather than weight percent. That gives a better sense of the element ratios. But if you really want to confirm a compound’s chemical structure, it’s better to use tools like FTIR, XPS (X-ray Photoelectron Spectroscopy), or XRD (X-ray Diffraction). They’re more reliable for that kind of analysis.
Workingbear once wrote an article explaining how to use EDX to estimate the chemical formula of pyrite (FeS₂)—Understanding the EDX Report: Can EDX Be Used to Estimate a Sample’s Chemical Formula? If you’re interested, check it out—there’s also a comparison between EDX and FTIR that might be helpful:
“How to Identify Unknown Contaminants: Choosing Between EDX/EDS and FTIR“
📌How to Read an EDX/EDS Elemental Report
- How to Identify Unknown Contaminants: Choosing Between EDX/EDS and FTIR
- Understanding the EDX Report: Why Does the Same Element Have Multiple Peaks?
- Understanding the EDX Report: Can EDX Be Used to Estimate a Sample’s Chemical Formula?
📌 Conclusion
Energy-Dispersive X-ray Spectroscopy (EDX/EDS) is a fast, non-destructive method for analyzing the elements in a sample. It’s widely used in materials science, electronics manufacturing, forensics, and more. When paired with an electron microscope, it not only shows the surface details of a sample but also reveals its chemical makeup—making it a powerful tool for both research and industry.
Related Posts:


Leave a Reply